The debt is extreme. The real question is whether the growth curve catches the capital curve.
Chanos actually understated it. Today Nebius spends closer to $10 of capital per $1 of revenue on an annualized basis — 18× on a trailing-twelve-month base. The $4× figure isn't the current state; it's roughly where the ratio lands if management delivers the 2026 revenue guide against today's debt stack. What isn't in question: Nebius already spends more of each revenue dollar on interest than any peer we can find. Whether that ends as a debt trap or a growth story depends entirely on the top-line curve landing where management says it will.
Every AI infrastructure company borrows to grow. Nebius spends 2–3× more of each revenue dollar on interest than any peer.
TTM interest expense divided by TTM revenue, ranked. Data centers, hyperscalers, and pure-play AI compute names on one axis. Nebius is the outlier by a wide margin.
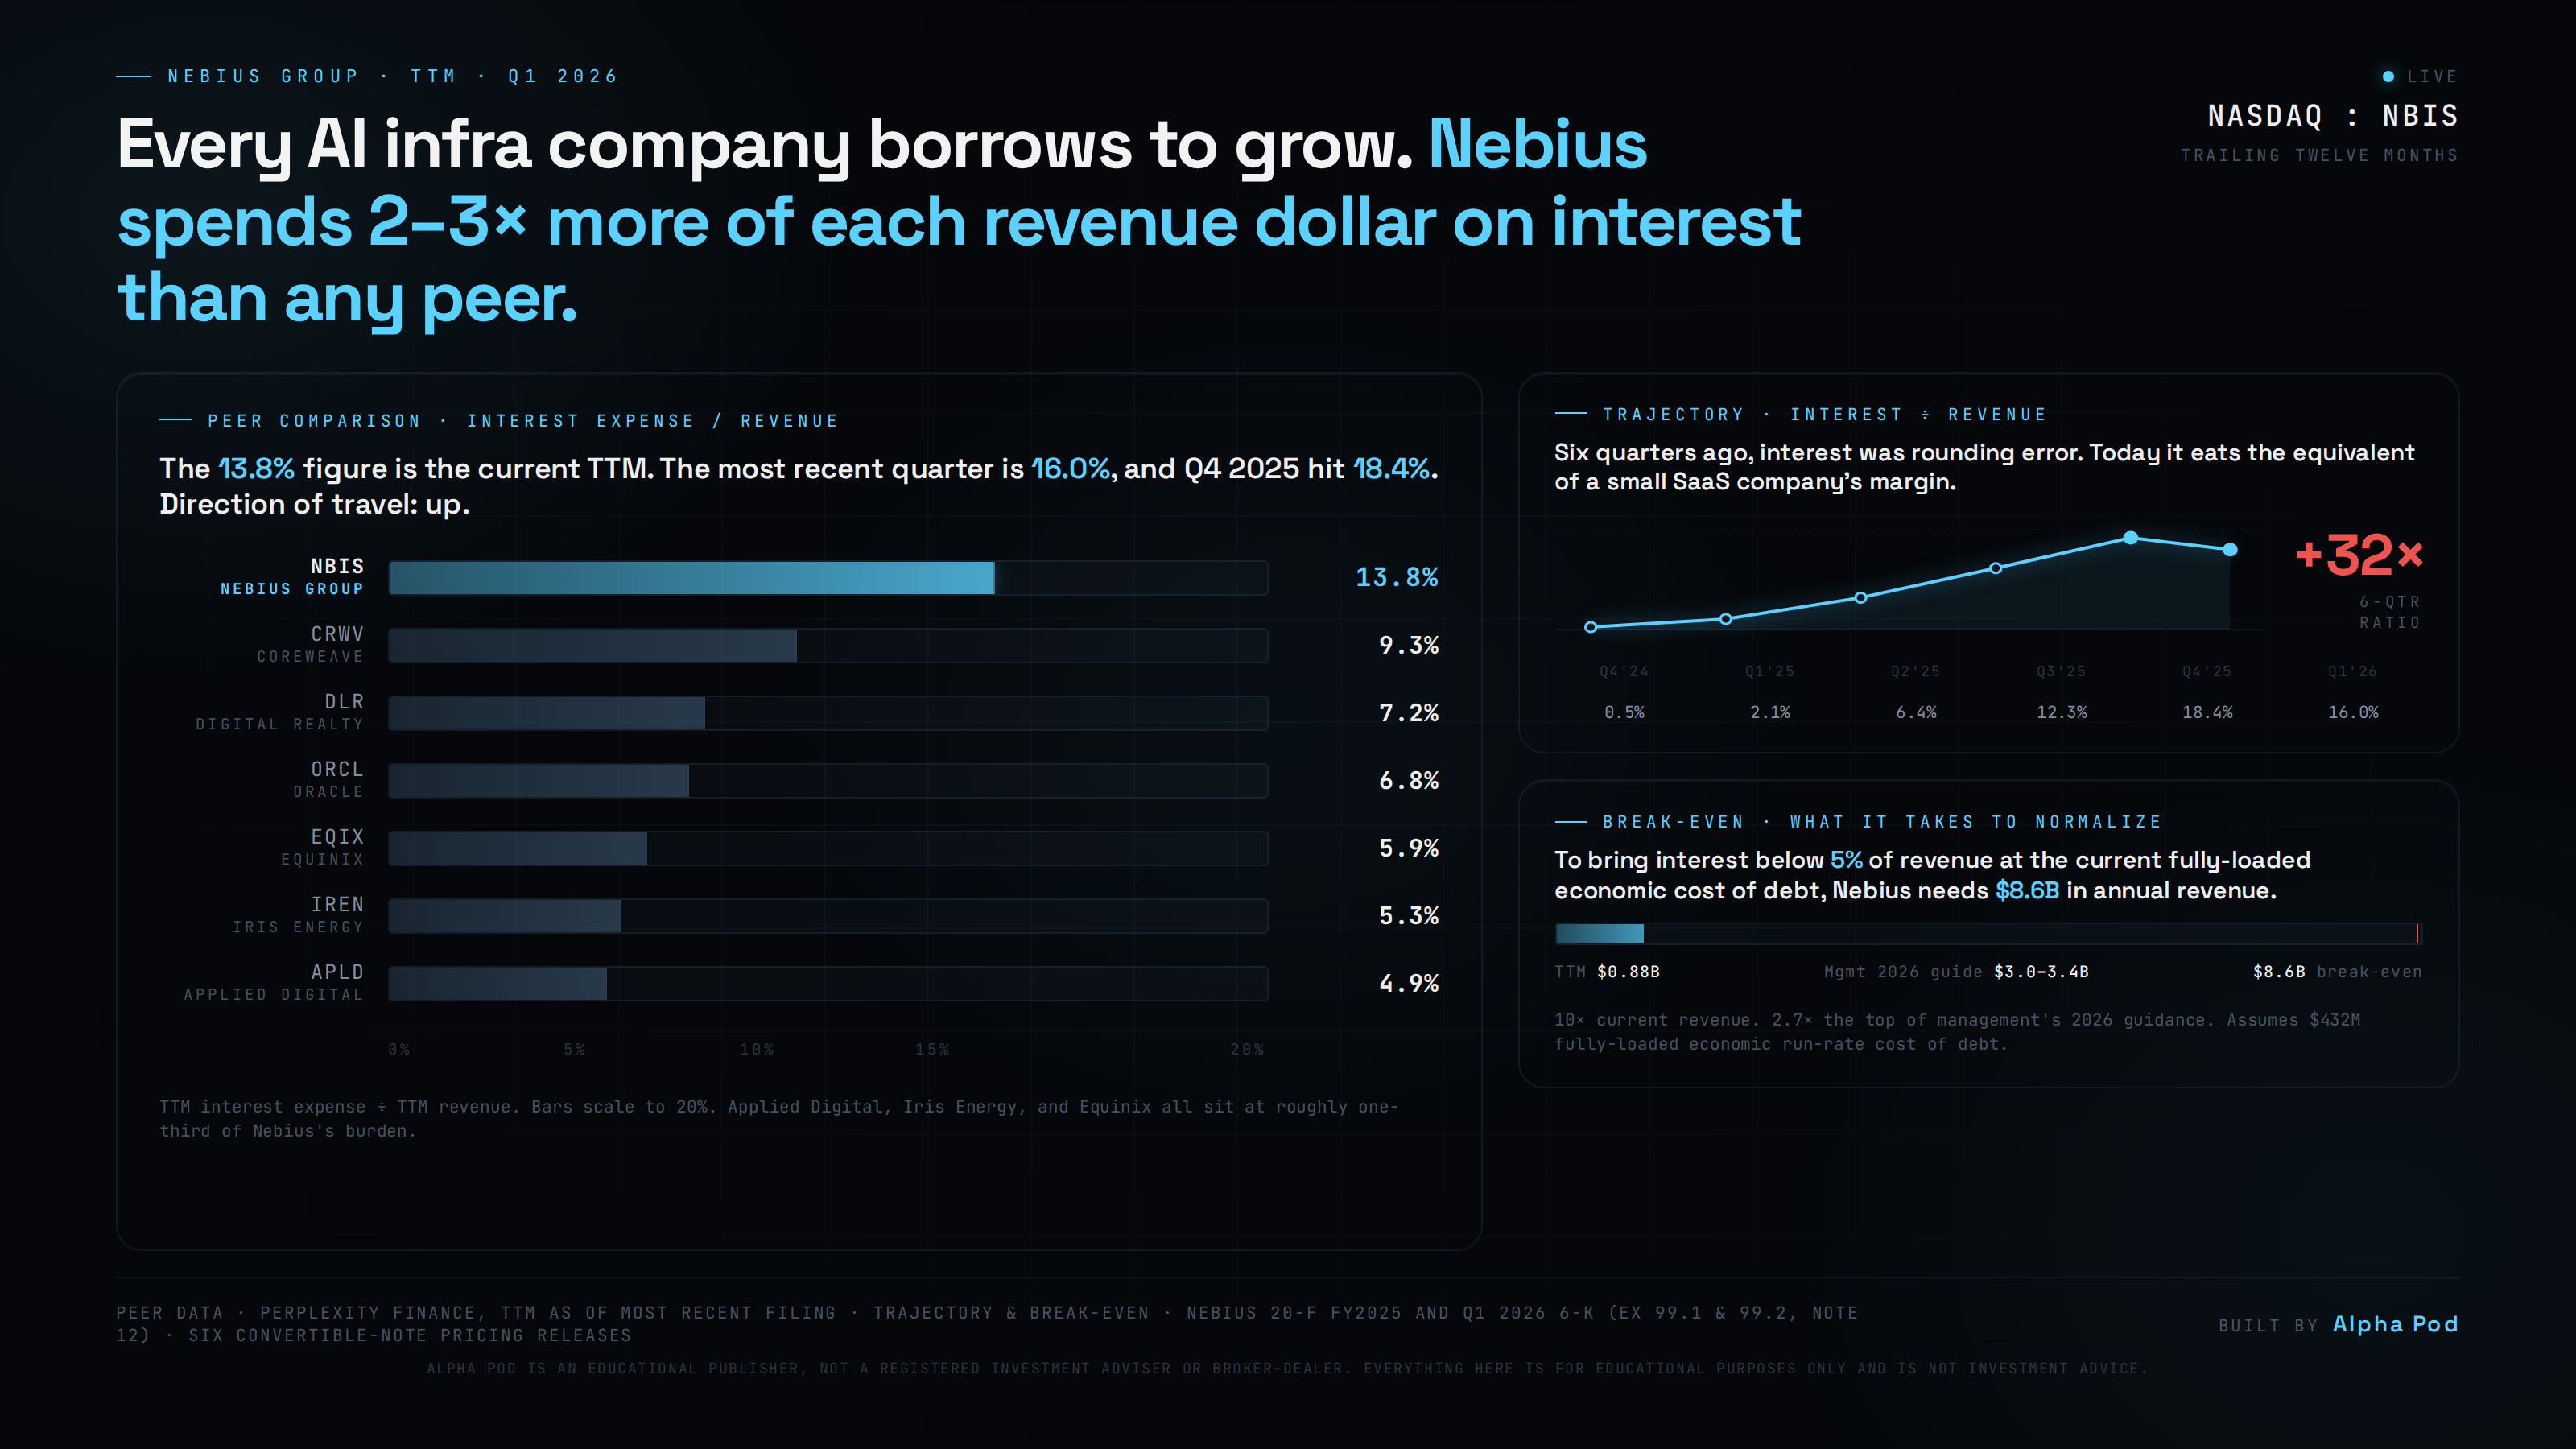
NBIS spends 13.8% of every revenue dollar on interest. The next-closest peer is CoreWeave at 9.3%. Applied Digital, Iris Energy, and Equinix all sit near 5%. This is not a "capex-heavy business" problem — every name here is capex-heavy. It's a Nebius problem, and the direction of travel is up.
Six quarters ago, interest was rounding error. Today it is 16% of revenue.
Nebius resumed operations post-divestment with net cash. Interest income exceeded interest expense every quarter through Q1 2025. By Q4 2025 the cross was decisive. This is a very recent problem, and it's still accelerating.
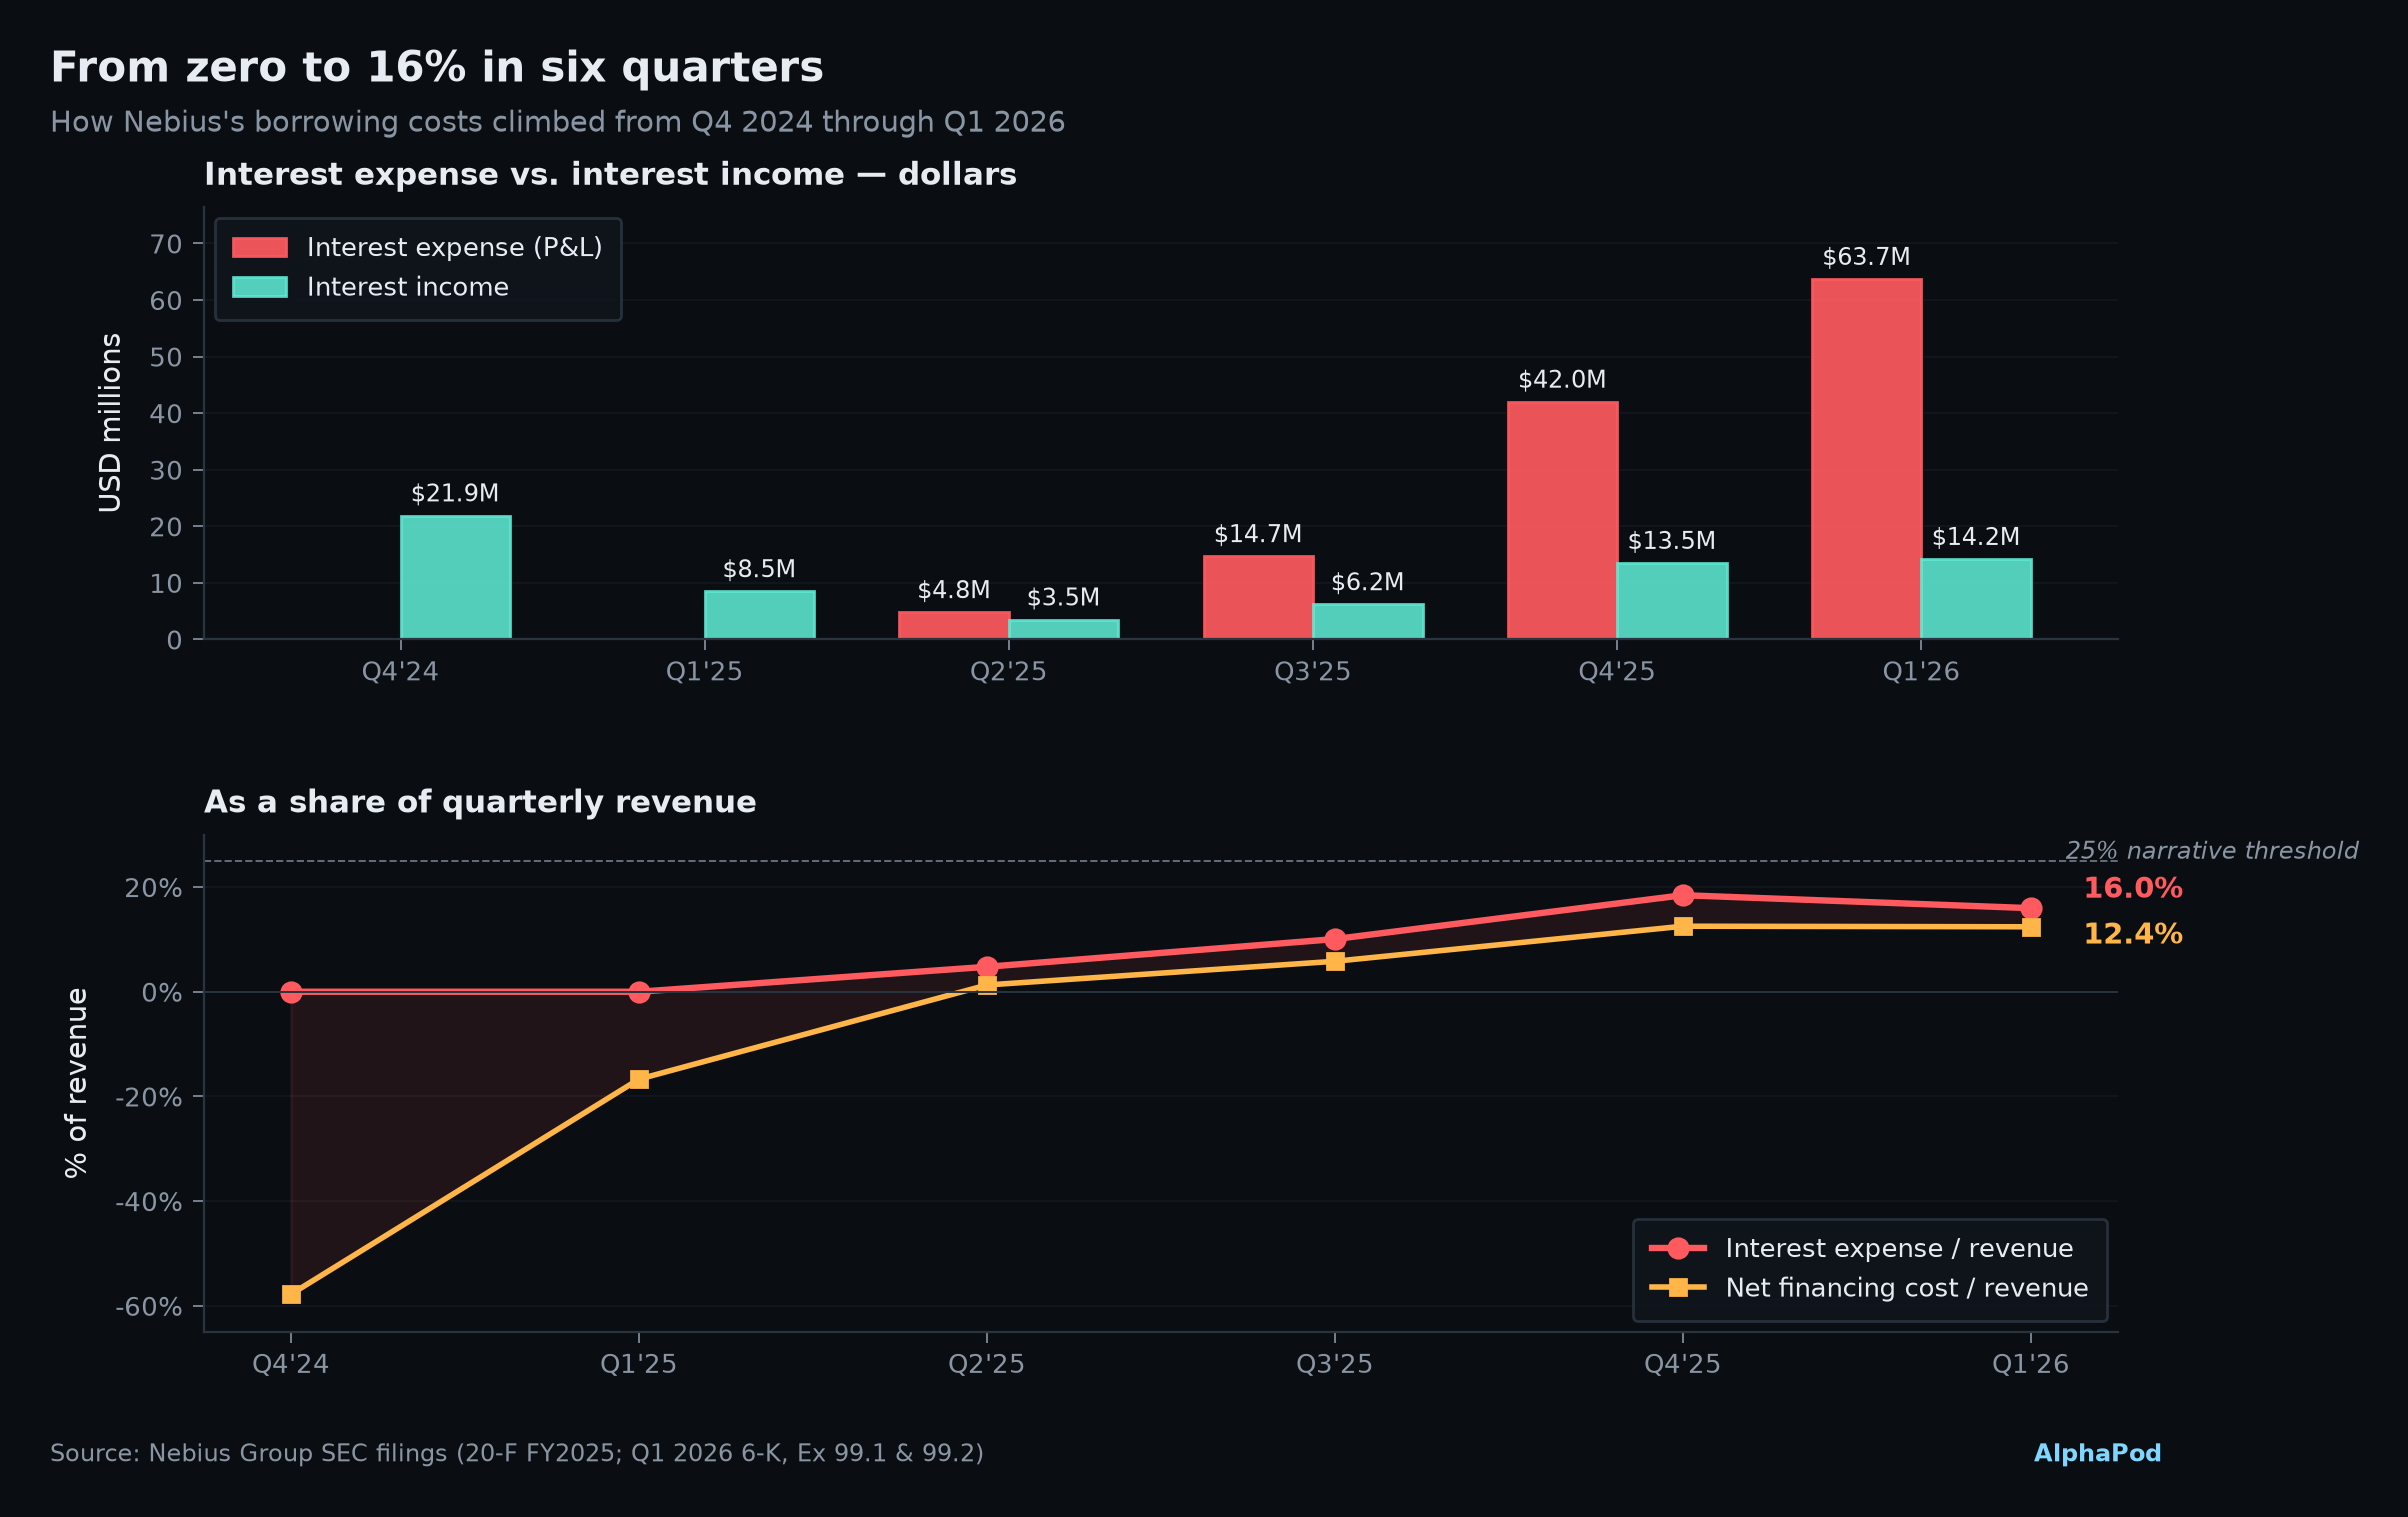
Q4 2024: net financing cost was -58% of revenue (they earned money on cash). Q1 2026: net financing cost is +12.4% of revenue. That's a 70-point swing in six quarters — and interest income is still meaningful because $9.3B of raised cash sits on the balance sheet earning yield. Once that deploys into capex, the offset disappears.
The stated coupon says 1.9%. The economic cost is 5.09%. A $1.57B deferred obligation.
All six senior unsecured convertible notes accrete to 115–125% of face at maturity. That premium is a real cash obligation on the maturity date — it just doesn't show up as interest expense the way a coupon does. GAAP amortizes it through the P&L over the life of the note, which is why reported interest expense is climbing faster than the coupon math alone would predict.
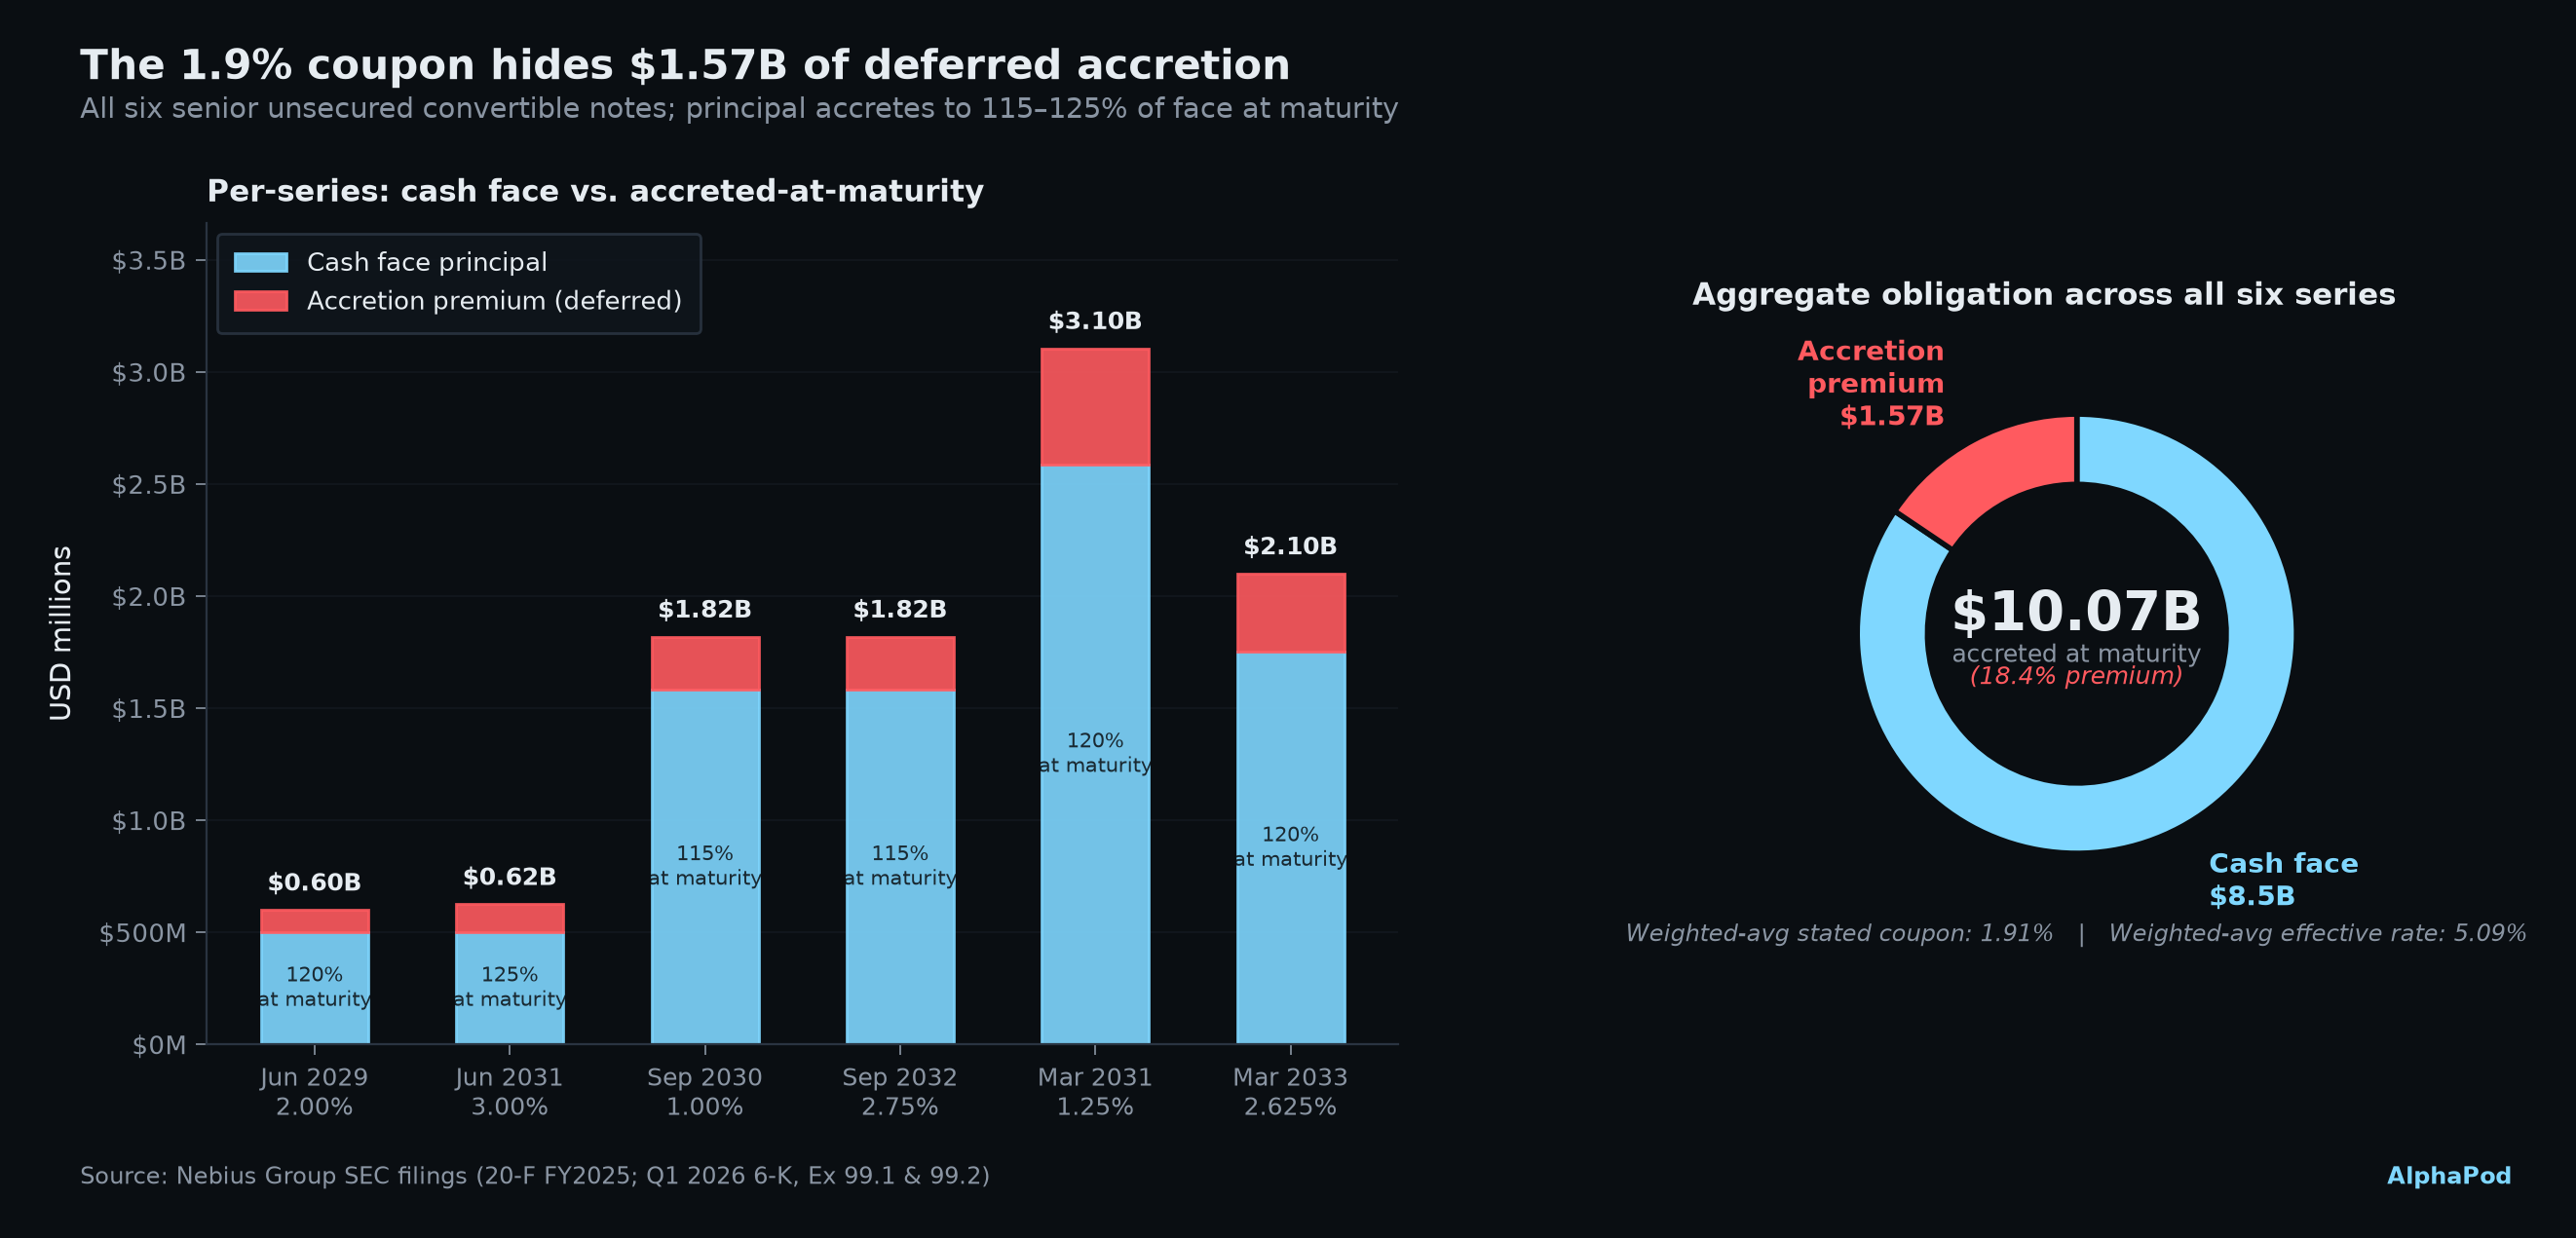
$8.5B in cash face today. $10.07B owed at maturity between 2029 and 2033. The gap — $1.57B — is deferred interest hidden inside a headline coupon that reads like a growth-stock number. Any analysis that uses the stated 1.9% coupon undercounts the real economic burden by a factor of 2.7×.
Chanos said $4 of capital per $1 of revenue. The current run-rate is 9.8× — worse than he claimed.
There's no single "right" way to test the claim. On a trailing-twelve-month revenue base it's 18×. On a Q1-annualized base it's 9.8×. On FY24 continuing operations it was 36×. On no reasonable measure is it currently at 4×. To hit the Chanos target, Nebius has to grow into it — the exact question our reply raised.
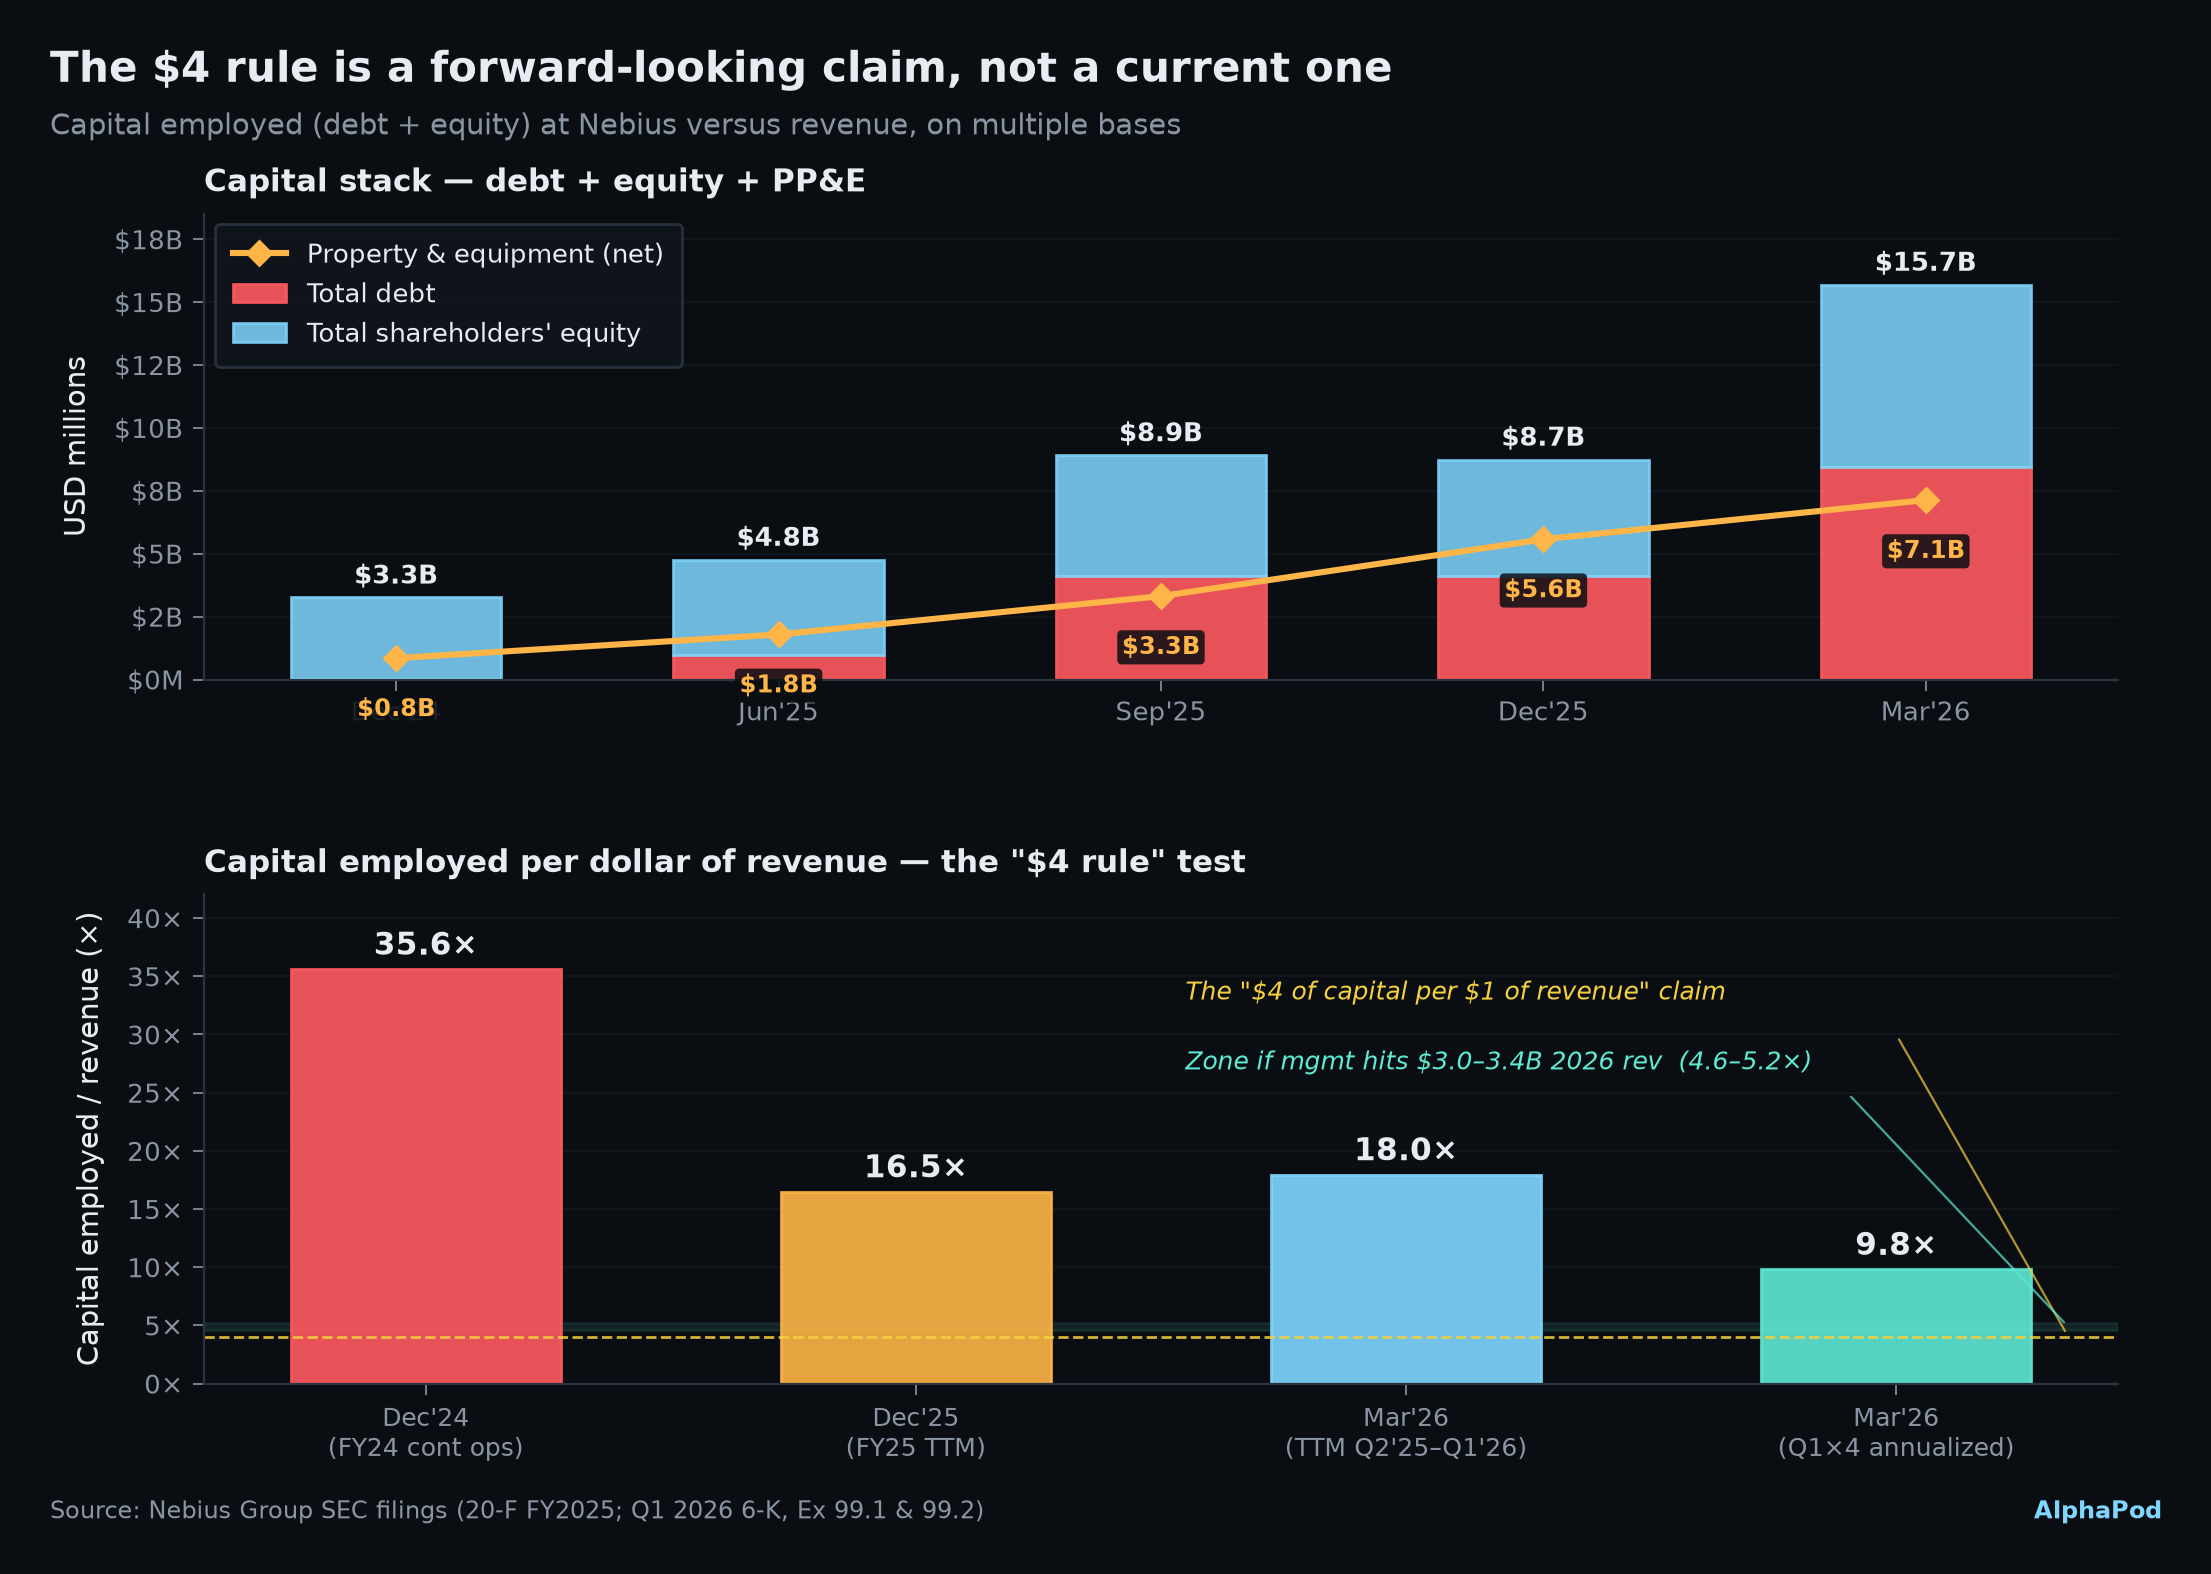
The Chanos $4 claim is directionally correct as a forward projection: if management hits the 2026 guide of $3.0–3.4B, the ratio compresses to 4.6–5.2× — right at his line. If they miss, it stays above 9×. This is the entire debate on Nebius reduced to one number.
Under management's own guidance, interest-to-revenue collapses from ~14% today to ~5% by 2028.
Scenario A holds debt flat at $8.5B and models three revenue paths. Scenario B adds $2.5B in each of 2027 and 2028 to fund capex. In every path except a hard bear case with continued borrowing, interest normalizes.
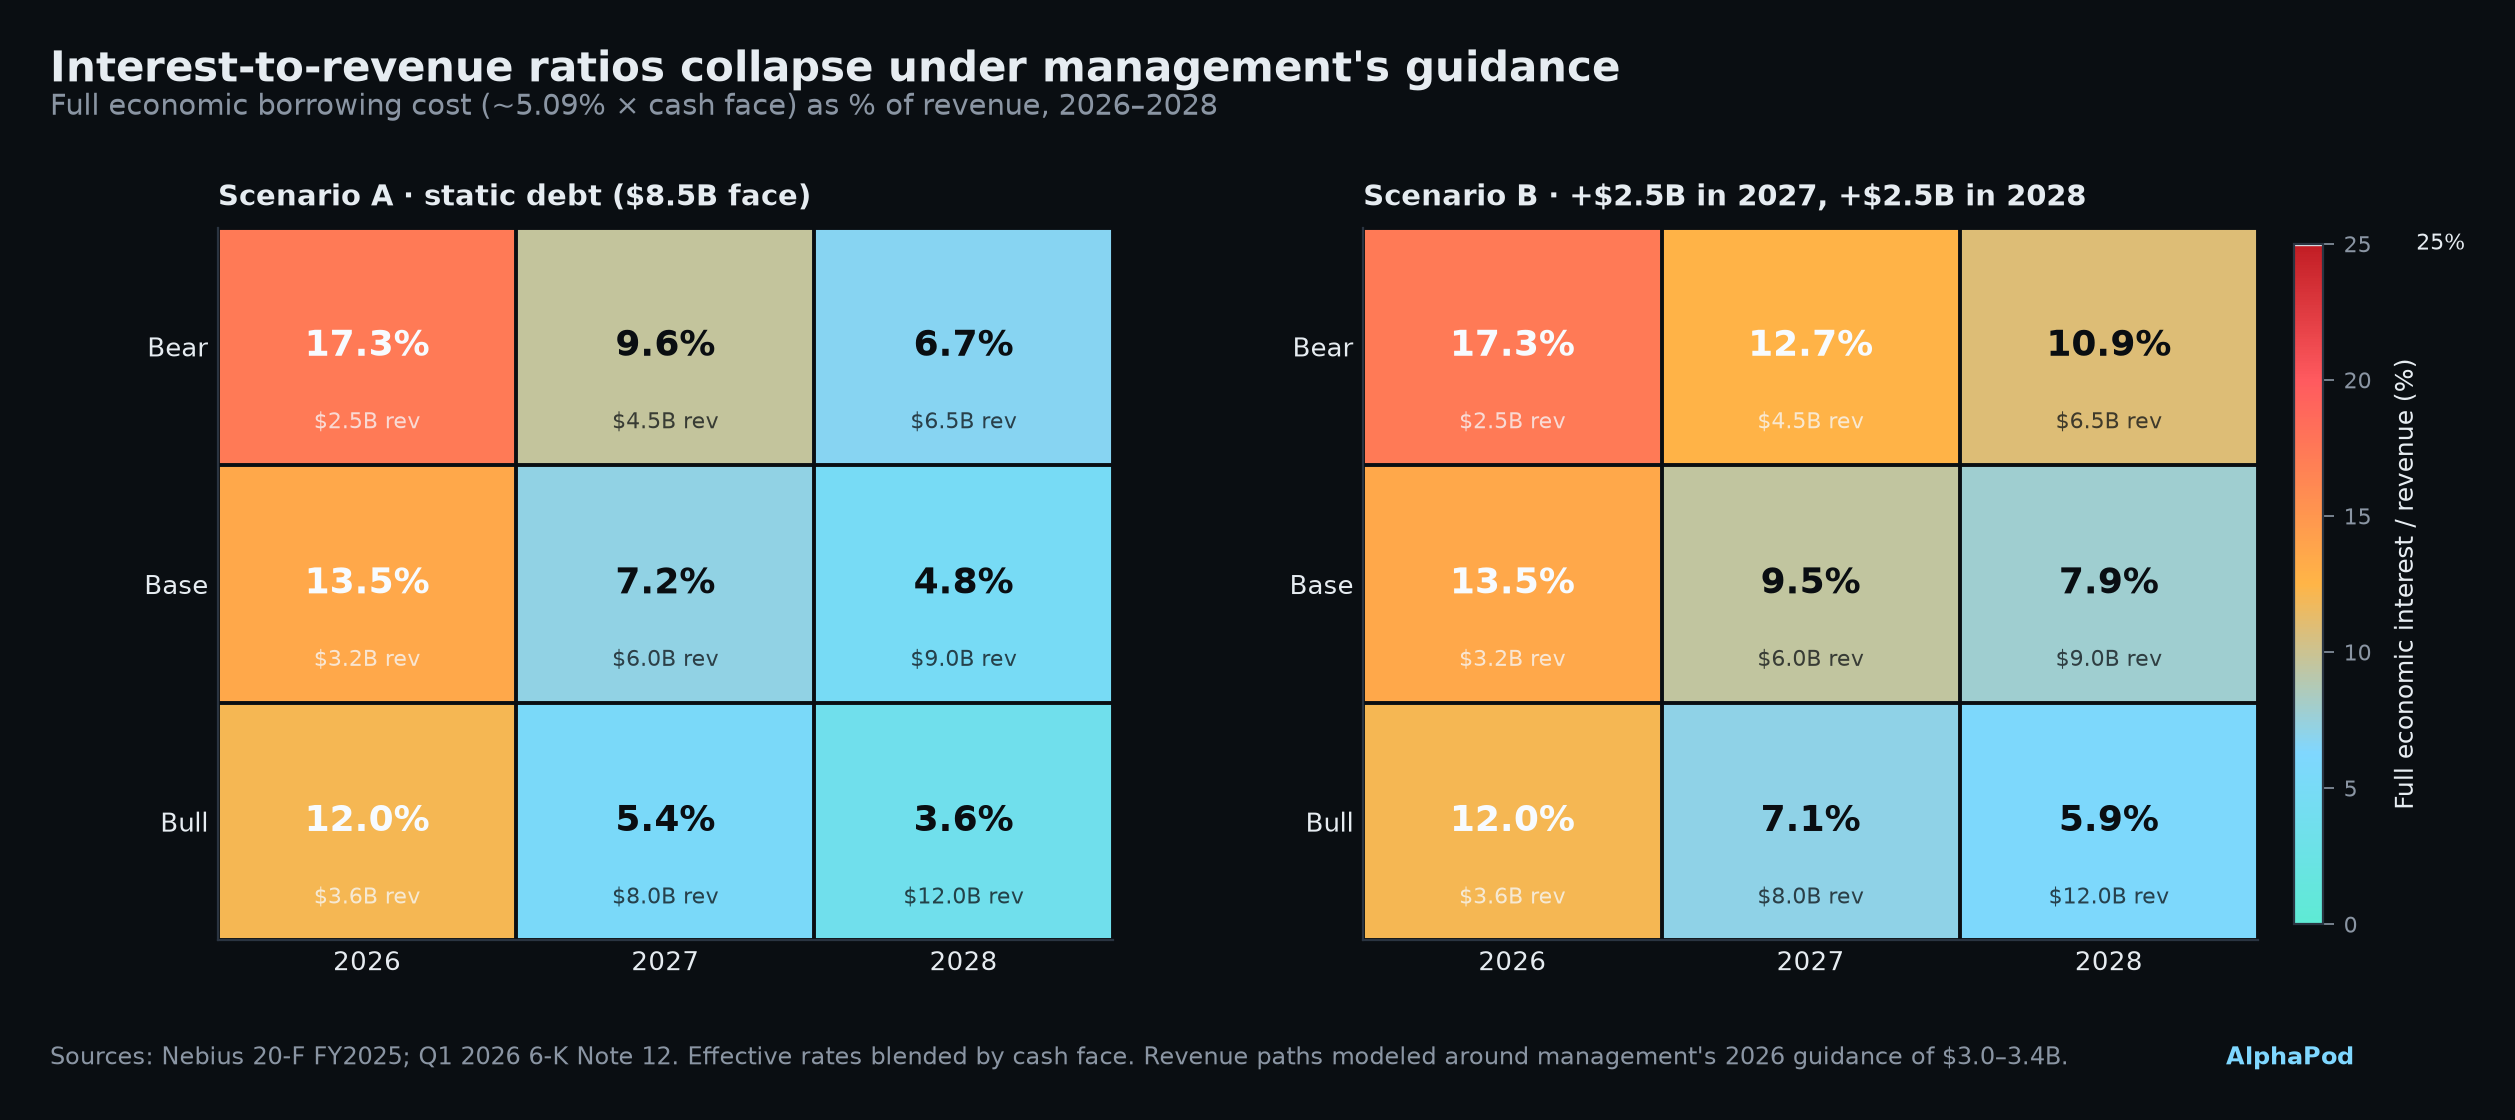
Base case 2028 (static debt, $9B revenue): 4.8%. Base case 2028 with another $5B borrowed: 7.9%. Bear case with growing debt: 10.9% — better than today. The math for growing into it exists on paper. It requires revenue landing where management says it will — a demand-side, sales-execution, GPU-utilization question, not a balance-sheet question.
The current-state critique is defensible.
NBIS's capital-per-revenue ratio, interest-to-revenue ratio, and effective debt cost are all worse than every reasonable peer. The 1.9% coupon narrative undercounts real cost by 2.7×. On today's revenue base, Nebius is capital-inefficient by any yardstick. None of this is arguable.
Every ratio compresses fast if the top-line lands.
Management's $3.0–3.4B 2026 guide, coupled with the $21.3B backlog reported at year-end, is what has to convert. If it does, the Chanos $4 rule is met by 2026 and interest normalizes below 5% by 2028. If revenue misses, the equity holders pay for the miss twice — once in dilution from the convert, once in growing accreted principal.